
Basic principles of CT
CT scanners comprise a doughnut-shaped opening with an xray tube on one side and a curved row of detectors on the other, both of which rotate around the patient while he or she is steadily moved through the opening on a mechanized table.
Since its inception in 1971 CT has undergone a number of significant evolutions. The first scanners were only capable of imaging the brain. Subsequent whole body scanners imaged a single 10 mm ‘slice’ of the patient each time the xray tube and detectors slowly rotated around the patient. This was a relatively tedious process which was prone to blurring due to patient motion, and which could only produce images oriented in a single (transverse) plane.
With progressive improvements in technology, our current ‘multislice’ CT scanners can image dozens of extremely thin (0.6 mm) slices of the patient every time the xray tube and detectors rotate; the speed of rotation has also increased to three times per second, meaning that, for example, a 64-slice scanner can image 192 slices per second. This rapid acquisition capability allows images of the heart to be captured without any degradation by motion, and also means that head-to-toe imaging of trauma patients can be performed in a matter of seconds.
The data acquired by the CT scanner can be rapidly processed into images that are oriented in any desired plane: transverse, sagittal, coronal, oblique or even curved. With other post-processing software, 3D images can be generated, and specific tissues can be subtracted from the image (for example, leaving only bone). These advances have made CT a very useful tool indeed in the imaging assessment of a huge variety of pathological conditions everywhere in the body.
However, the radiation dose to the patient from CT studies is among the highest delivered by any of the imaging equipment that we use, which means that this technology needs to be used judiciously. A number of recent high-profile publications have highlighted the potential danger of the overuse of CT, with the possibility of inducing malignant tumours. Future generations of CT scanners will therefore not only be focused on generating even faster, higher resolution images, but also on achieving this with a significantly lower radiation dose.
Contrast-enhanced CT

A vial of iodinated contrast for CT injection.
With a few exceptions (notably the assessment of acute intracranial pathology, interstitial lung disease, fractures and renal tract calculi), the majority of CT scans are performed following the administration of an iodinated contrast medium.
When injected intravenously, contrast increases the density of blood vessels and organs; as a consequence, lymph nodes can be easily distinguished from blood vessels, and abnormal lesions in solid organs become easier to distinguish from normal surrounding parenchyma. When intravenous contrast cannot be given (for example, patients with a contrast allergy or renal impairment), our ability to interpret CTs for certain pathological process is severely affected.
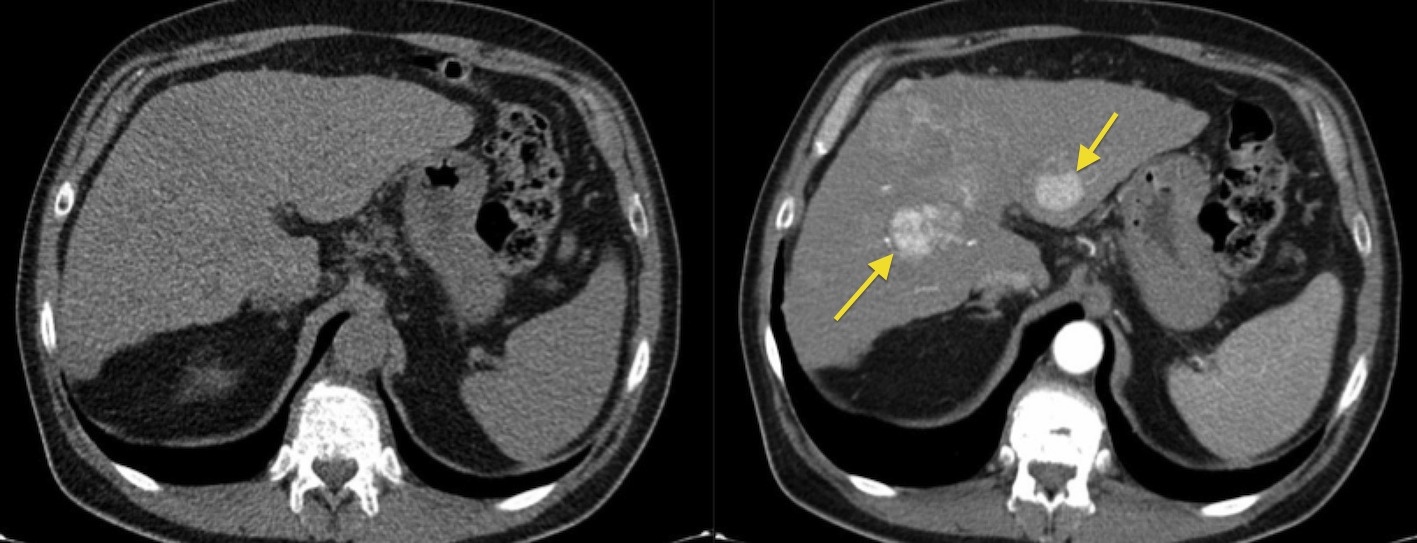
This example illustrates how much we can miss when forced to perform a non-contrast CT in someone with renal failure or a contrast allergy. The image on the left, from a triphasic CT liver, has been performed without contrast; the liver looks a little bit nodular (the patient had cirrhosis) but otherwise fine. On the right is an image from the arterial phase of the CT, taken at the same position – it shows multifocal hepatocellular carcinoma (arrows).
IV contrast is usually injected using an automatic pump, and is given at a rate of up to 5 ml per second, depending on the type of study being performed. For this reason, good quality IV cannulae (20G or larger) are required. As the CT scan itself takes only a few seconds, it is very important that it is performed at just the right time, so that the contrast is where we want it to be when the images are obtained.
There are two ways of doing this; empiric timing and bolus tracking.
With empiric timing, when the contrast injection begins, a timer is activated and the radiographer waits a set amount of time before starting the CT scan. For example, for a portal venous phase CT liver, if we wait 60 to 70 seconds after the contrast injection begins, we will nearly always get pretty good opacification of the portal vein and the liver parenchyma. However, for studies like CT pulmonary angiography and CT angiography of the circle of Willis, the timing needs to be far more precise; to see emboli or aneurysms clearly, the arteries need to be densely opacified with contrast. In such studies, a process called bolus tracking is performed, where serial scanning is performed after the contrast injection begins so that we can actually watch the contrast arrive in the area we want to scan. This is illustrated in the CT PA example below.
The best way of understanding all of this is to watch a couple of CTs being performed. Make sure that you take the opportunity to observe some scans during your time in the department – it won’t take very long.
Iodinated contrast is usually also administered orally when abdominal CT is being performed, to opacify the small bowel. This makes it easier to distinguish normal bowel from pathological lymph nodes or other mesenteric masses. Oral contrast is given to the patient one hour before their CT, as a dilute solution made up to one litre (and mixed with Miwadi orange, in an attempt to disguise its awful taste). Patients are instructed to drink a cupful every ten minutes or so.
CT-guided procedures
CT is used for needle guidance when we need to biopsy something that we either cannot see or cannot safely access on ultrasound. It is more time consuming than ultrasound-guided biopsy, because we have to move the needle, stop and scan, then move the needle again, and stop and scan, repeatedly until the needle reaches the correct position.
In addition to the extra time required, CT guided procedures are associated with a radiation dose (both to the patient and, if CT fluoroscopy is being used, the operator and assistants). CT is used routinely for lung and bone biopsies, and occasionally for retroperitoneal masses or technically difficult liver or renal biopsies.
CT is also used as guidance for radiofrequency ablation of lung, liver and renal tumours in patients who are not suitable for surgical resection (see IR section).
How density is measured with CT
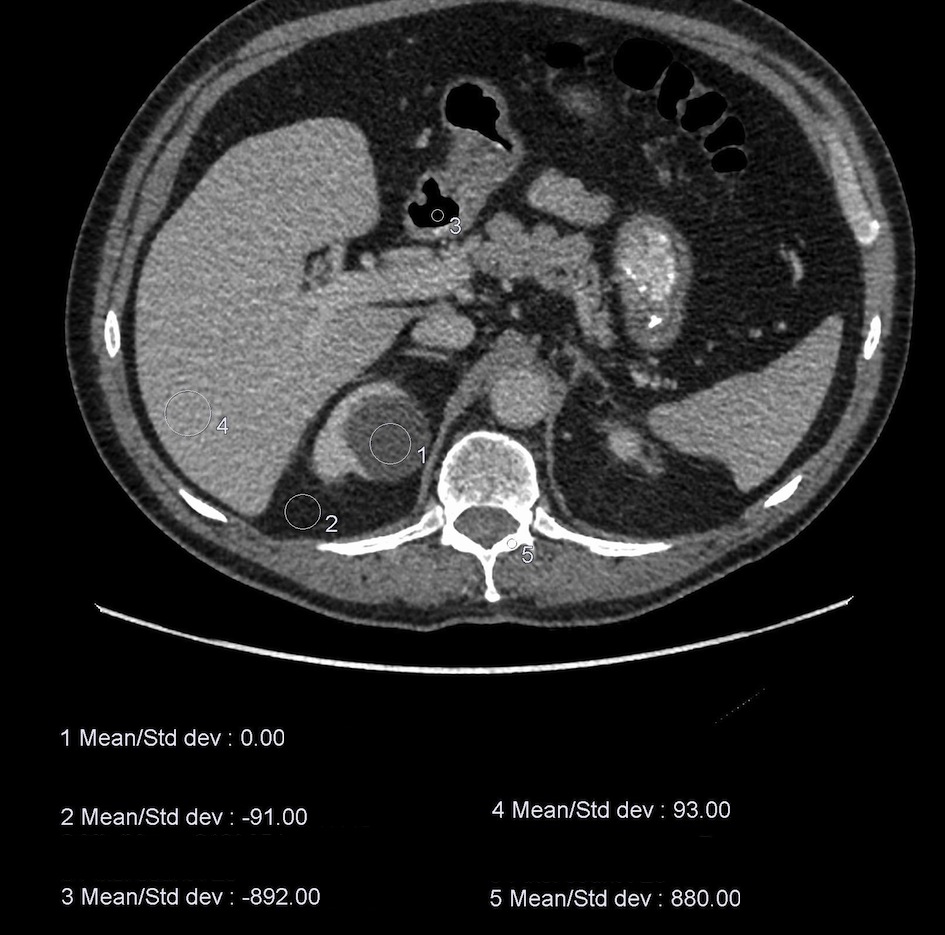
When a CT is performed, the density of a tissue is assigned a measurement called a Hounsfield Unit (HU). The density of water is defined as 0 (zero) HU. Anything that is more dense than water will have a positive HU value (for example, soft tissue, calcification/bone, metal implants), while anything less dense will be negative (i.e. fat and air). When we’re interpreting a CT scan, it is useful to be able to take a measurement of the exact density of a structure to be certain that we are dealing with, for example, a cyst. The example below shows an image from an abdominal CT with five density readings (from circular ‘regions of interest’).
‘Windowing’ a CT image
When we are reviewing a CT, the images are displayed on a certain ‘window’ setting. What is meant by this is that the image is manipulated so that is optimally displays the tissues that we want to assess, usually at the expense of some other tissues. There are several window settings that are used routinely; the ones you should know about are ‘soft tissue’, ‘lung’ and ‘bone’ windows. When evaluating a CT, for example a chest study, we routinely review the scan on each of these windows – it is the same scan, from the same single data acquisition by the CT scanner, but they look completely different.
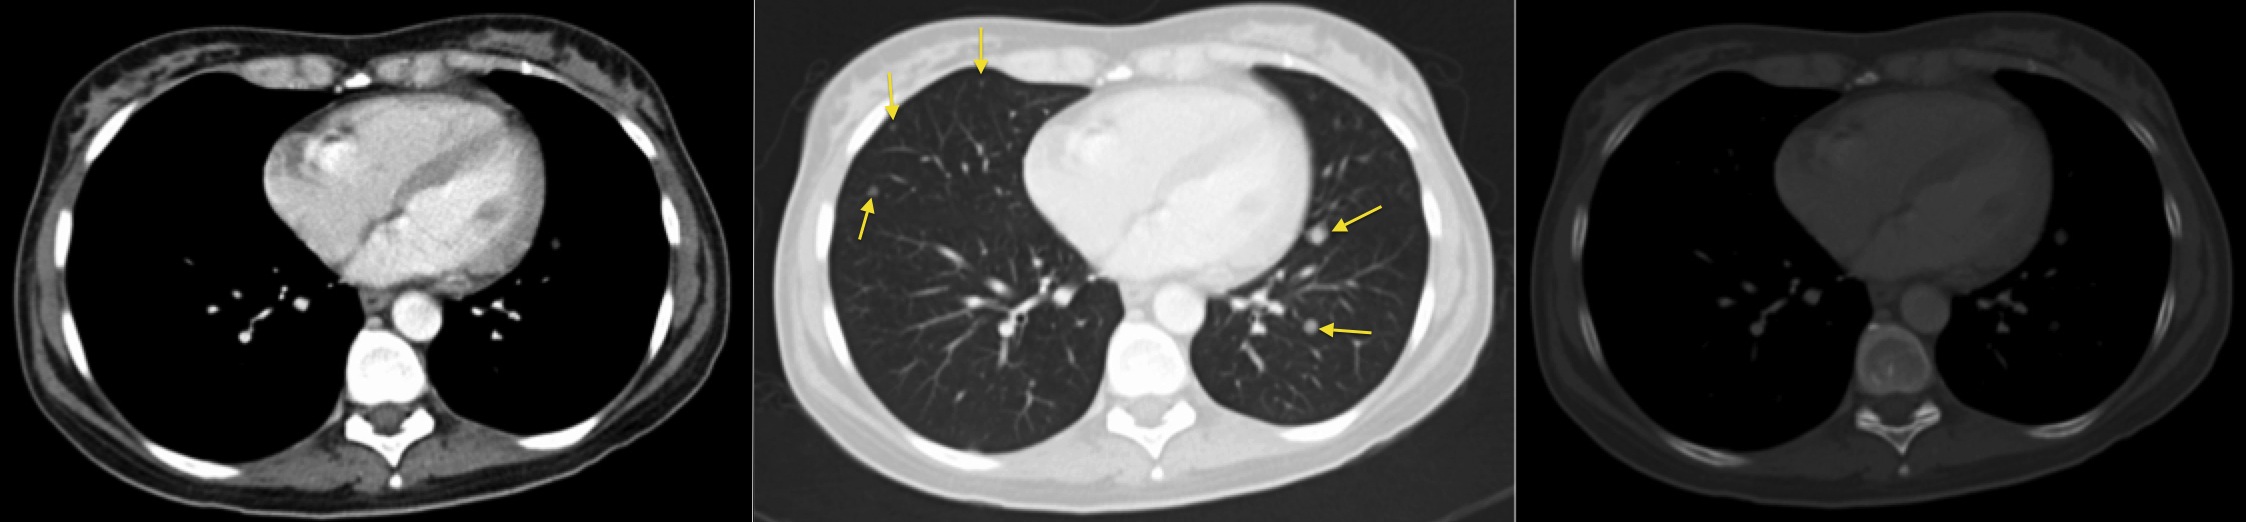
In the example above, this is the same slice of the patient displayed on three different window settings. On the left is a soft tissue window – we can clearly see the difference in density between muscle and fat, for example. However, we can’t say much about the lungs. The middle image is a lung window – it’s harder to see the difference in density between soft tissue structures, however we can now see multiple lung nodules that were invisible on the soft tissue window (arrows). These were metastases. The right-hand image is a bone window – if you compare the bones to the other two windows, you can now see a clear difference between cortical and medullary bone. This allows us to identify fractures and metastases that would be subtle or invisible on other windows.
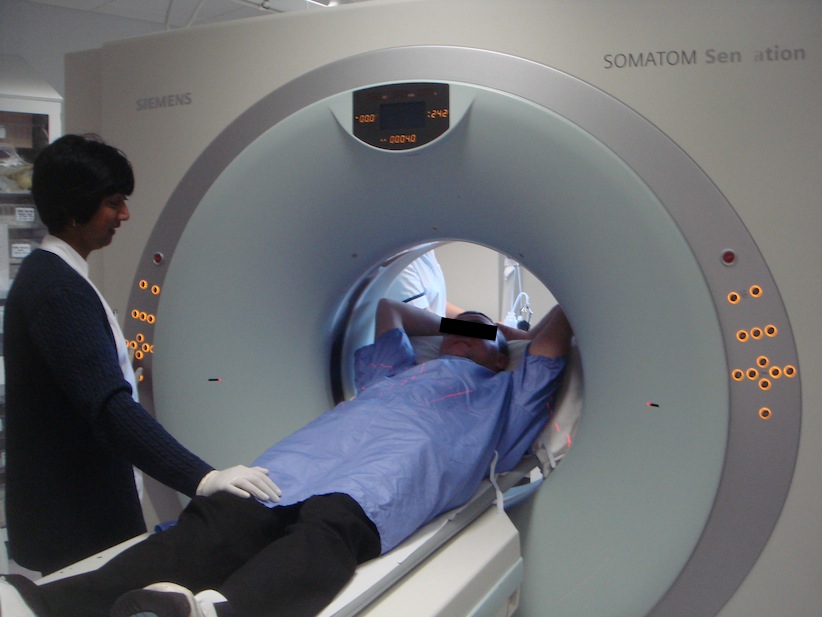
CT at SVUH
There are two 64-slice multidetector CT scanners in the department: one on the second floor and one beside the ED. We perform over 90 diagnostic CTs per day, in addition to one or two daily CT-guided procedures.
Siemens 64-slice CT scanner at SVUH.
Some of the more common CT examinations we perform are listed below. You will see examples of most of these during your week with us.
CT TAP (thorax, abdomen and pelvis)
This is routinely performed for oncology staging, post-chemotherapy restaging, and for screening for malignancies, when clinically suspected (for example, when a patient presents with symptoms due to a cerebral lesion which looks like a metastasis on imaging)
CT brain
The most common indications for this are for stroke or head injury (noncontrast) or neoplasms (contrast enhanced)
CT thorax and liver
This contrast-enhanced study is for the assessment of suspected lung tumours, and includes the upper abdomen which therefore allows us to detect liver and adrenal metastases
CT angiography
This can be used for assessment of suspected aortic dissection or aneurysm, for diagnosis of stenosis, occlusion, dissection or embolism in the carotid, vertebral and peripheral arteries, and for diagnosis of intracranial aneurysms, evaluation of patients with acute GI haemorrhage, and evaluation of patients with suspected mesenteric ischaemia
CT PA (pulmonary angiography)
For the diagnosis of PE; when negative for PE, this will often show alternative pathology to explain the patient’s symptoms
High resolution CT thorax
This non-contrast study is used for the diagnosis of interstitial lung disease and for the follow-up of patients with cystic fibrosis
Cardiac CT
Used for the noninvasive diagnosis of coronary artery stenosis
CT abdomen
For acute, subacute or chronic abdominal symptoms, including bowel obstruction, perforation, appendicitis, diverticulitis, inflammatory bowel disease, pancreatitis, abscess formation
Three- or four-phase CT liver
This comprises non-contrast, arterial, portal venous +/- delayed phases, and is used for diagnosis of primary liver tumours, liver metastases from certain primary neoplasms (such as melanoma or neuroendocrine tumours), and for liver transplant work-up
CT colonography
An increasing number of patients are being referred for this relatively new CT study. It can be used for screening for colon cancer in asymptomatic patients, and for full evaluation of the colon in symptomatic patients who have had an incomplete colonoscopy (for example, due to severe diverticulosis). A rectal tube is used to distend the colon with CO2 prior to the scan being performed. The CT is reviewed using software that allows a ‘fly-through’ of the bowel lumen, also known as virtual colonoscopy.
CT KUB (kidneys, ureters and bladder)
This is a non-contrast CT used for identification of renal and ureteric calculi. When negative for ureteric calculi, CT KUB will often show an alternative cause for the patient’s symptoms, such as acute diverticulitis or appendicitis.
Triphasic renal CT
Non-contrast, arterial and excretory phases. For the evaluation of renal masses, particularly for renal cell carcinoma
Spine and extremity CT
This is used for the diagnosis of radiographically-occult fractures and for more detailed pre-operative assessment of known fractures
The CT service at SVUH is available 24 hours a day; the majority of the overnight CT scans that are performed are CT brain examinations.
The Components of a CT scan
During your rotation, you should make the effort to observe a couple of CTs being performed, particularly contrast-enhanced studies. It won’t take you very long – they’re over in a matter of seconds. It would be worthwhile having some knowledge of the process involved. This is briefly described and illustrated below, but there is no substitute for seeing one for yourself.
Scout
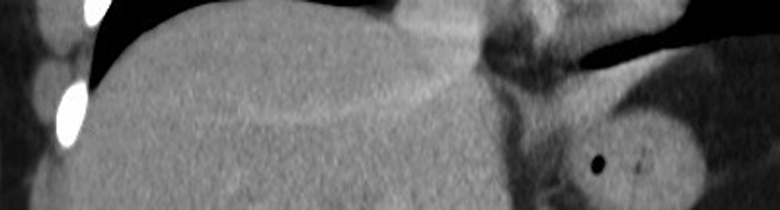
The first step in any CT is to work out exactly what part of the patient we’re going to scan. The CT scanner doesn’t know this automatically, therefore we have to perform what is called a ‘scout’ image, or topogram, first. The scout image is obtained by moving the patient through the bore of the scanner while the xray tube and detectors are activated but are not rotating around the patient. The result is a digital image that looks very like a plain xray (see example below). The CT radiographer looks at the scout image and then tells the scanner where the CT slices should begin and end.
Contrast injection
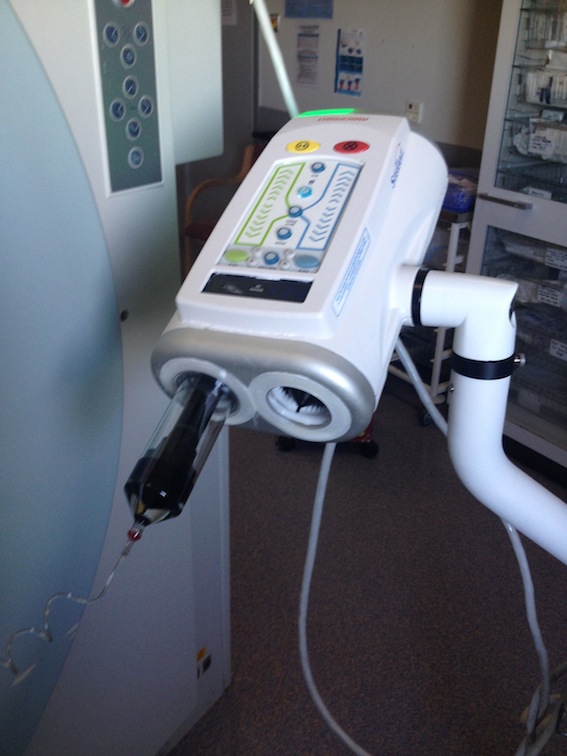
The automated pump used for CT contrast injection.
Oral contrast will have been given to the patient an hour before the CT if an abdominal study is being performed. If the CT is to be a post IV contrast study, then the patient will be cannulated with an 18G or 20G cannula, usually in the antecubital fossa. The IV contrast is injected using an automated pump, with a rate of flow that is preset by the radiographer and which depends on the type of study being performed. For oncology or abdominal scans, a rate of flow of around 2ml/sec is used; for arterial studies (e.g. CTPA), a higher flow rate of up to 5 ml/sec is required in order to ensure that the arteries are very dense on the CT images.
Data acquisition
The scan itself takes very little time; we can scan from head to toe in around 10 seconds. However, the timing of the scan is incredibly important. If performed too soon after the IV contrast is injected, there may not have been enough time for the contrast to make it to the area we’re scanning. If performed too late, we can potentially miss the short period where the contrast is in, for example, the pulmonary arteries. If either of these things happen, the CT may be non-diagnostic and the patient will have received a significant radiation dose for nothing.
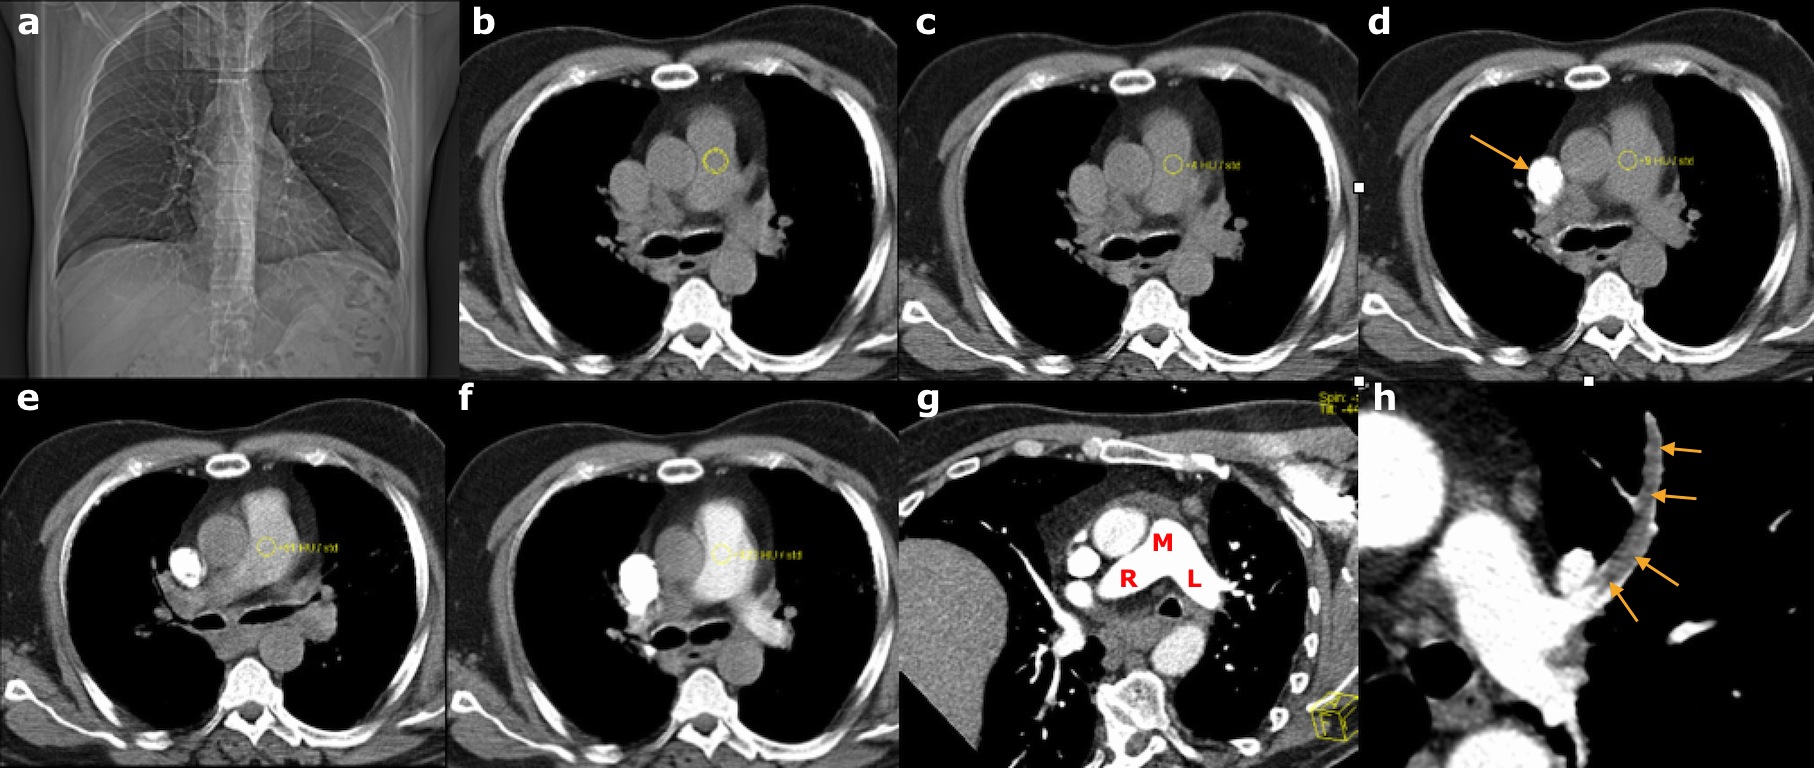
These images illustrate the steps involved in performing a CT pulmonary angiogram. (a) is the scout image; this is performed first and is used to select the ‘range’ of the CT – in this case, the radiographer will start the range at the lung apices and finish at the diaphragms. (b) A non-contrast CT slice is obtained at the level of the main pulmonary artery, and a circular ‘region of interest’ (ROI) is placed over the artery by the radiographer. The IV contrast pump is started, following which the scanner takes a single image through the pulmonary artery every 2 seconds, measuring the density each time. On (c), the density is +4 Hounsfield Units (HU). On (d) you can see the contrast arriving into the SVC (arrow). By the next image, (e), the density in the ROI has reached +51 HU, while on (f) it is 123 HU. This is above the threshold set to initiate the CT, therefore the scan is performed. (g) shows the excellent enhancement of the main (M), right (R) and left (L) pulmonary arteries while (h) shows a large filling defect, representing a PE, in the left upper lobe artery (arrows).
Post-processing
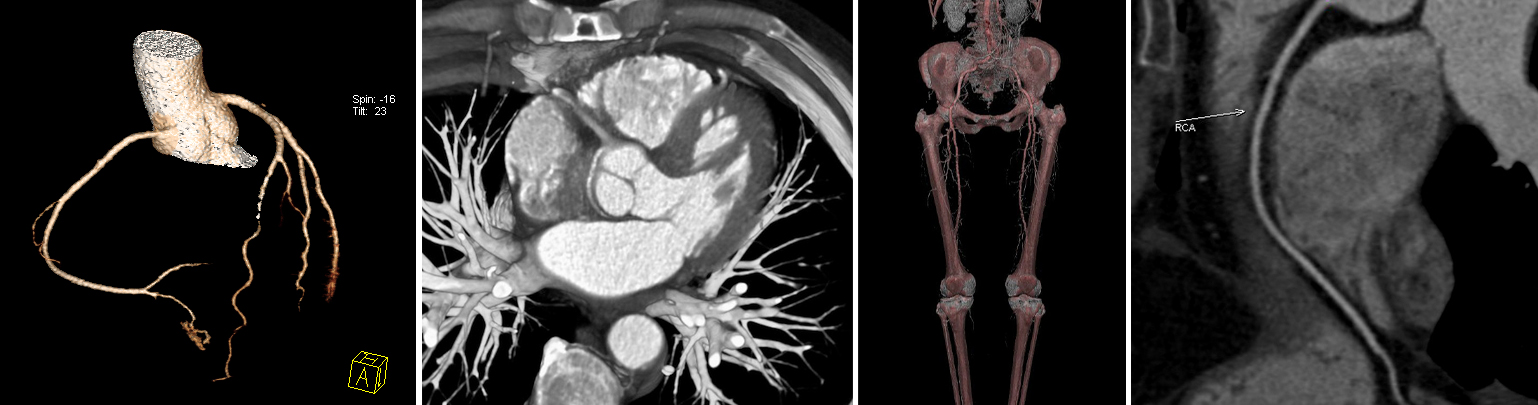
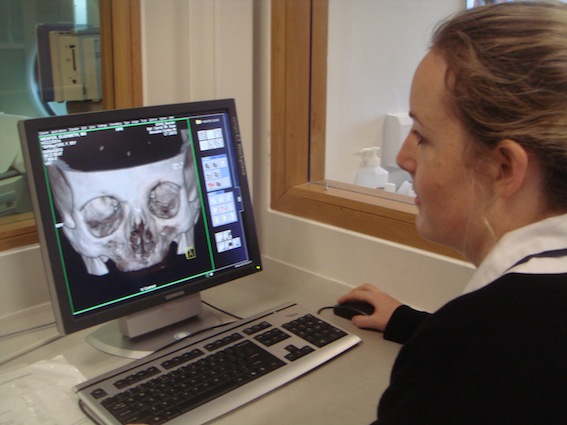 Following data acquisition, the scanner automatically constructs axial images of the body part that has been imaged. Before the images are sent to PACS for reporting, the radiographers then perform any necessary post-processing, depending on the type of scan and the reason for scanning. For example, for abdominal CT it is routine to also review the images in the coronal and sagittal planes. For chest CT, the axial images are post-processed to optimize the appearance of the lungs. For fracture assessment, post-processing is performed so that all of the soft tissue structures in the image are subtracted, leaving only the bones. This can make it easier for the orthopaedic surgeon to plan internal fixation. Some examples are shown below.
Additional post-processing can be performed by the Radiologist reporting CTs on their workstations as required.